Postscript 2010
The above report describes a study I made back in 1987 – 1991. At the time my tools included a good communications receiver (Yaesu 7700) coupled to a Commodore 64 computer. The connection was cobbled together via the game port interface. Looking back, it seems amazing that it worked at all. Today with modern receivers like my Icom R75 we can connect directly to a modern personal computer with the radio’s built-in interface. Monitoring several bands becomes an easy pursuit with the correct software.
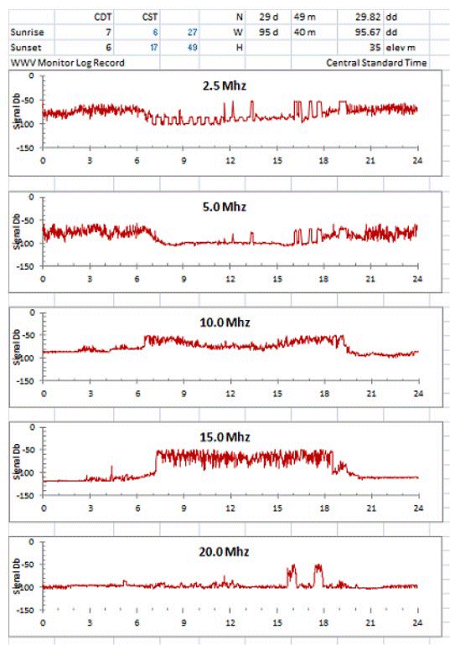
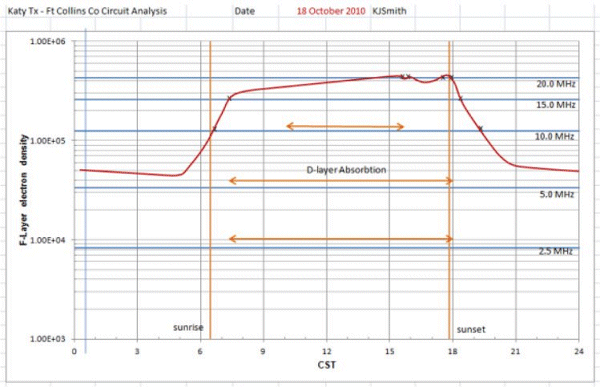
Below I provide two figures made with my current setup. The date 18 October. The record shows simultaneous monitors on 2.5, 5.0, 10.0, 15.0, and 20.0 MHz WWV. The easiest bands to interpret are for 10 and 15 MHz. For 2.5 and 5 Mhz the record is best interpreted in terms of D-layer absorption. 20 MHz is barely reached except for two small blips at 16 and 17h CST.

Below is my “ionosond” display for that day.

Would that I had such equipment back in 1997. Times have changed and so has the hardware with which we use, but the work goes on!
Return to contents..
Go back....


