Signal Strength by Solar Activity
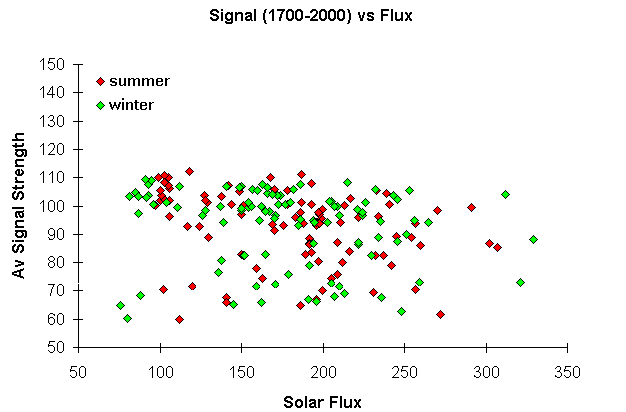
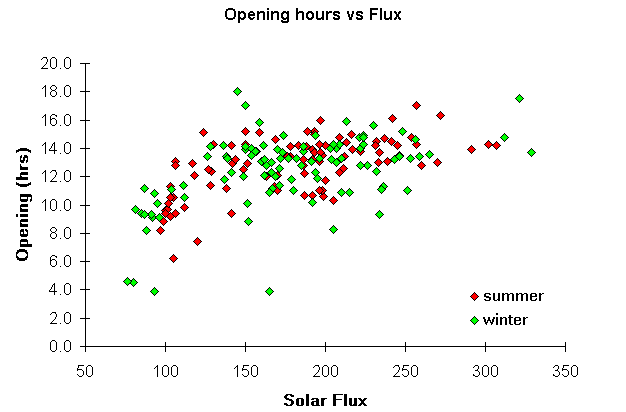
The following charts show the relationship of solar flux to signal strength and to the length of time for an opening for propagation along a circuit. Color coding provides an indication of the variation due to season as seen in the previous section. In this case I have distinguished "summer" from "winter" data on thess charts in the following way: Winter = October to March, Summer = April to September.

Plot of signal strength averaged over the midday period 1700 - 2000UT (11-13 CST). For both summer and winter seasons I see a weak but real inverse relationship of decreasing average signal strength with increasing solar flux. It has often been stated that propagation improves during times of high solar activity, this data suggests otherwise. Increased ionization levels increase the signal absorbtion as well. Also, times of high solar activity bring instabilities in the earth's geomagnetic field. Both of these effects have an important impact on signal strength.

Solar activity (flux) on the other hand does indeed improve the conditions in terms of the length of the openings, especially for levels of flux above about 120. This is logical when considering the overall increased ionization levels. While the increased ionization may actually hurt signals by increasing absorbtion and causing greater geomagnetic instability, it does make for longer openings.
Next: The "grass", noise revealed..
Return to contents..
Go back....


