Poor Man's Ionosonde
My reading suggested a solution to the ionization problem described in the previous section. This solution dispenced with the notion that the jump in signal strength was caused by some jump in F layer ionization. It can be found in the relationship between the main parameters affecting propagation: Nec - electron density (cm^-3), v - frequency, and a - incident angle measured from vertical. The expression is as follows:
Nec = 1.2 x 10^4 v^2 cos^2 a
If this expression were true, then it was simple to devise a test to confirm it. If the ionization truly proceeded at a much slower rate, it should affect different radio frequencies at different times, in a regular manner. The beacon, WWV, transmits as previously stated at several frequencies, 2.5, 5.0, 10.0, 15.0, and 20.0 MHz. With this beacon, I could maintain the same basic circuit geometry. In mid November, 1988 I conducted a series of recordings at 5.0, 10.0, 15.0, and 20.0 MHz which, when plugged into the above expression gave me discreet electron densities.
      F Elev  Angle a 	Frequency
			5 MHz  10 MHz  15 MHz  20 MHz
	250	71	3.34+E4
	240	71	       1.24+E5
	230	72		       2.59+E5
	220	73			       4.26+E5
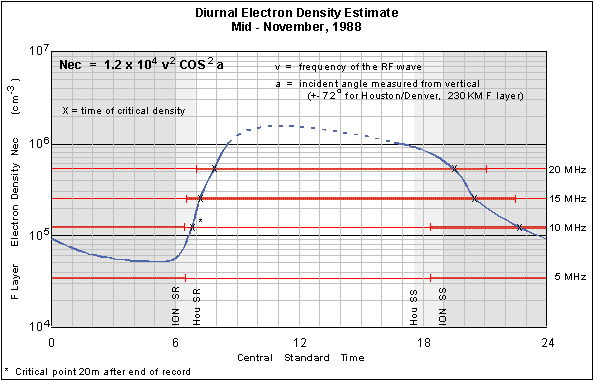
The signal jump would give me the exact time that the F layer passed the calculated critical density. The following chart is my curve of the diurnal change in density, a sort of "Poor-man's" ionosonde.

The plot shows that the ionosphere goes through a morning period of fairly rapid ionization peaking perhaps around 10am CST (1600UT). Then the process stops and reverses, going through a slower recombination period in the evening and into the night until near ionosphere sunrise the process again reverses and repeats the rapid ionization. This plot in fact compares quite well to published mid-lattitude ionosonde data such as Olivier and others, 1988. It is even possible, where circumstances permit, to see more rapid ionospheric variations as described in the following section.
Next: Density waves..
Return to contents..
Go back....

