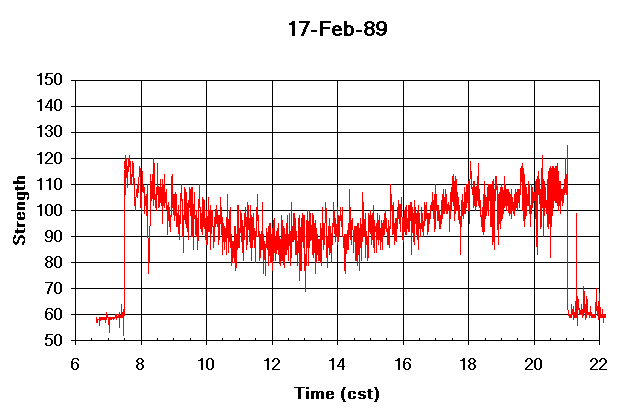
The interface between the receiver and computer uses a voltage to ohms converter which proved very acceptable but, being a resistance device, was suseptable to temperature induced drift. In Houston that was generally only a problem in the spring or fall where large changes in day to day temperature are typical in the Gulf of Mexico's battle against the continent for dominance of the climate of the region. I made occasional calabrations as necessary to the interface and kept the base level within a narrow range. The following list gives the correspondence between the digital signal strength readings presented on the charts and the radio's S-meter output:
		S-meter		Computer
		  S0		  60
		  S3		  79
		  S5		  90
		  S7		 101
		  S9		 112
		 +10db		 132
		 +20db		 157

Note also two important features of the record, the very sharp discontinuities at the beginning and end of the "opening", and the general sag or lower strength of the signal at mid-day. More on the discontinuities later, the sag itself is due to increased absorbtion by the lower D layer at it reached full ionization near midday and dissipates by the afternoon. There is an assymetry to the opening as well with a longer period of strong signal in the evening than in the morning. I attribute this to the geometry of the Houston-Ft. Collins curcuit with Ft. Collins being to the west. By the time the F layer ionizes in the morning at a point halfway between Houston and Ft. Collins, the lower D layer is already ionized, conversely, in the evening there is still a couple of good hours remaining for the F layer after the D has dissipated.
Base level, (S0) on this record is 58, the solar flux that day was quite high at 239 and the geomagnetic field was quiet. The resulting record is pretty close to ideal which is actually quite unusual. In all, the project ran for nearly four years from just after sunspot minimum to past sunspot maximum and resulted in nearly 200 weekly records. The next section provides additional views giving a flavor of the variability possible, and why.