We have seen how to look at background radiation and what it can teach us about the statistical analysis of radiation data, and we have looked at a few commonly available radioactive sources and why the variety isotopes is so limited. This experiment should allow one to look more deeply into the nature of the radiation itself. Any text concerning ionizing radiation will explain the three particles, or types of radiation involved 1) Alpha: two protons and two neutrons, essentially a helium nucleus, 2) Beta: a single electron for each beta decay, and 3) Gamma: a "ray" or photon particle defined by its energy state more than by a physical characteristic.
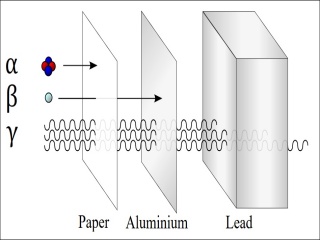
Most texts explaining radiation will include a required diagram like that shown at the upper left. Here one sees alpha particles stopped by a sheet of paper while a sheet of aluminum will stop a beta particle. Only a substantial thickness of lead can stop the mighty gamma. This diagram implies (incorrectly) a sort of step-wise relation and suggests, or at least suggested to me, an interesting experiment. Measure the total CPM of a sample, then re-measure with a sheet of paper to block out the alpha, and finally re-re-measure with a sheet of aluminum to block out alpha plus beta. With this data one would be able (were it true) to extract the counts for alpha, beta, and gamma by difference.

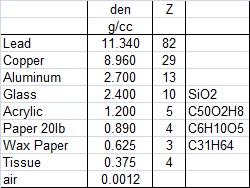
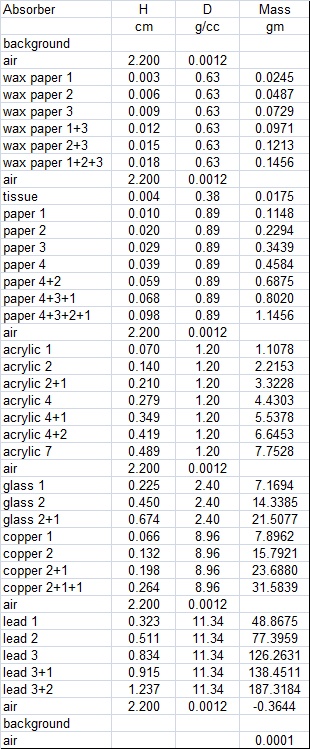
If you try this you will quickly discover things do not work this way. Every measurement with a different absorber will yield a different count. Being systematic here will pay dividends. Getting organized, I began by building the inventory of absorbers in the photo below. These range from a single piece of light tissue paper to a 1/4 inch slab of lead. I was seeking to assemble a set of absorbers with a very wide variety densities and masses. I figured the greater the mass, the greater the absorption. My materials are included in the table at left giving the density carefully measured and/or researched. I also give the atomic number although I did not make use of this information in my experiment.
The setup consists of the Geiger counter laying flat on a table with an open wire platform one centimeter above to hold the radioactive sample. Between the platform and the counter was a space into which I placed the absorbers. I ran the experiment twice, once with a uranium sample and once with a thorium sample. At the bottom of the page is a detail listing of the experimental program consisting of a full 42 measurements with different absorbers and absorber combinations. Each measurement was integrated over 15 minutes so, from the background study, I expect my precision to be plus or minus 5%. To get greater precision would require too much time. As things turned out, this works quite well.

I will go straight to the results before discussion the theoretical underpinnings. The following chart plots all the measurements in terms of CPM versus absorber mass. The mass is a simple calculation based on the density, thickness, and collecting area for each measurement, and tabulated at the bottom table. It is immediately apparent that two separate trends in the data are present, this got interesting! While my interpretations and conclusions are plastered all over the plot, please bear with me for an explanation for how I got there. Theoretical underpinnings will come next.

The plot above shows the main trends with an inset for a more detail look at the corner near the Y-intercept. I interpret the two trends as those for Gamma and Beta radiation. My instrument and measurement setup is very challenged for Alpha radiation, although, pushing things, I suggest some 3% just the same.
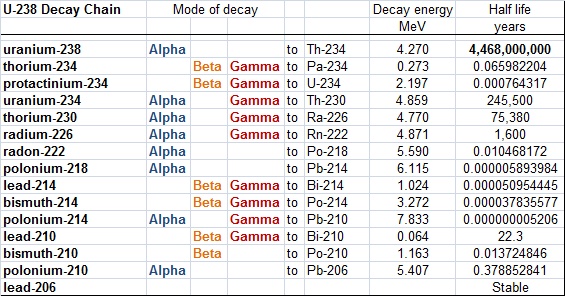
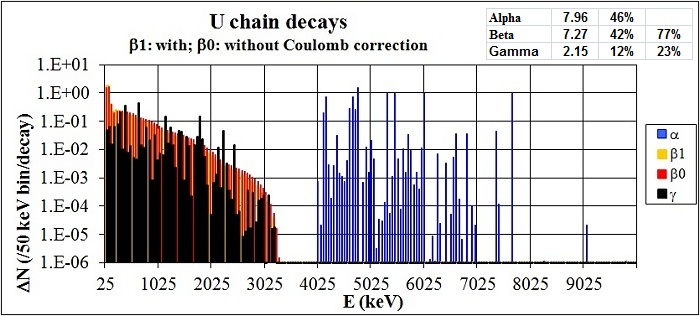
Below I have a table for the U-238 decay chain and below that a chart I found a few years back in a spreadsheet for which I neglected to note the reference. Still, this chart, and the U-238 decay chain table tell me that uranium decay should produce all three types of radiation with gamma at 12%, beta at 42% and alpha at 46% of the total. As my setup detects alpha poorly, I have re-normalized this to show, without alpha, the expected radiation should be some 23% gamma and 77% beta. My own data suggests 23% gamma, 74% beta with a possible 3% alpha, pretty close!
A note about my chart: My plot crosses CPM against Absorber Mass. This is basically an Intensity Attenuation Plot although my units are based on my primitive instrumentation. Note that the regression formulas on the plot (gamma for example: y = 17164 e-0.006x) follow the pattern Y = Yo * exp (-zX). Where Y is the dependant variable CPM, Yo is the Y-intercept (no absorber), X is the absorber mass in grams, and z is a constant unique for that relation.
This pattern is exactly the same as for the standard Linear Attenuation Equation. An excellent reference for this, with a derivation of the formula, may be found in wikibooks (Attenuation of Gamma-Rays
https://en.wikibooks.org/wiki/Basic_Physics_of_Nuclear_Medicine/Attenuation_of_Gamma-Rays).
The equation for attenuation is:
Ix = Io exp (-uX)
where:
Ix = intensity at any point along the Mass X-axis.
Io = the initial (no absorber) intensity = Y-intercept.
u = the Linear Attenuation Coefficient
X = the absorber mass.
This equation is actually meant for use with absorbers of a single given element (density) varying in thickness. Clearly, varying the thickness of absorbers of a given density essentially means varying the mass. The importance stems from the fact that radiation responds differently to different absorber materials. The atomic mass (Z) of the material impacts the results and of course, my absorbers have a wide range of atomic masses, (see table above).
This is why I chose to plot CPM (intensity) versus total absorber mass. Overall, this necessary blunder does not prevent interpretation or distinction between beta and gamma radiation. The absorber materials used are plotted with different colors and slight differences in the main trends between materials are apparent. These differences are certainly due to differing absorber Z values used. The detail insert shows this problem much more clearly. The paper trend and the wax paper trend are very different from each other and this also contributes to my difficulty distinguishing an alpha particle trend (if present).
My Attenuation Coefficients do not have standard units but are as follows:
Gamma: u = 0.006
Beta: u = 0.22
Attenuation coefficients are particle energy specific and these numbers would apply to the average particle energy of my sample. Gamma rays are clearly lightly attenuated and thus penetrate a lot of lead. Still, of the overall 74000 counts (minus 50cpm background) only 17114 counts can be attributed to gamma radiation.
Given the information I have on absorber Z, density, mass, and attenuation, I suspect there may be enough to calculate the average particle energy as well, but I have not found the "right" reference to go farther.
This has been great good fun. Now to get serious and try to do something useful with Muons next.